1 Introduction
1.1 Purpose of this book
Living labs - defined as physical or virtual spaces that bring together multiple stakeholders to collaboratively tackle societal challenges, fostering co-creation and real-world testing of solutions (Hossain, Leminen, and Westerlund 2019) - have become increasingly popular in development-oriented agronomy. However, we observe that such codesign processes nurtured in living labs often favor local knowledge over academic knowledge and are rarely informed by systematically collected data (Baudron 2024).
While local knowledge is invaluable, relying exclusively on it can inadvertently limit the creativity and problem-solving potential of the codesign process (Asten et al. 2009). In practice, this can lead to innovations that reflect existing practices (e.g., manure management, intercropping, minimum tillage) rather than exploring novel solutions to the key bottlenecks in the systems under study.
We argue that researchers have a crucial role in generating, organizing, analyzing, and presenting data at every stage of the codesign process — from diagnostic and needs assessment, to prototyping, testing, and evaluation (Giller et al. 2008). Diagnostics and analytical tools from systems agronomy can help make challenges, opportunities, and trade-offs more explicit, supporting evidence-based decision making and enhancing the creativity of the codesign process.
At the same time, data cannot simply be presented to Living Lab members in raw form. To be useful in codesign, data must be adapted to the audience, for example through visualizations, simplified tables, interactive tools, or role-playing exercises, while still allowing participants to draw their own conclusions. This approach aligns with the principles of discovery learning, where participants engage actively with information, explore patterns, and derive insights themselves, thereby improving understanding, ownership, and the quality of the codesign outcomes.
One example of a process where academic knowledge is essential and cannot be substituted by local knowledge is de novo design — the creation of novel cropping or farming systems that break away from existing practices and explore new possibilities (Meynard, Dedieu, and Bos 2012). Data-driven and model-based approaches allow researchers to explore alternative designs systematically, which can then feed into the codesign process in Living Labs.
This book presents a set of reproducible, data-driven workflows integrating KoBoToolBox with R. With the use of examples, the book provides clear, step-by-step guidance for researchers and practitioners on how data can be used to enrich codesign processes. The book was compiled using the bookdown package (Xie 2025), which enables the seamless integration of R code, analytical results, and narrative into a single, fully reproducible document.
A web version of this book is also available here: https://agritrop.cirad.fr/615910/.
1.2 KoboToolBox and R
For the workflows in this book to be usable by the largest number, our approach is based on two open-source softwares: KoboToolBox and R operated through R-Studio Desktop. We use these softwares because they are open-source, used by a large community of practice, and under constant development.
Digital surveys (e.g., using KoboToolBox) are much faster than surveys using pen and paper, reduce errors (no transcription and error trapping during recording) and allow for the data to be immediately available right after it’s collected. Digital surveys also offer the possibility of associating geolocations and multimedia data.
KoboToolBox is free and open access, and includes a free secured server, with summary analysis and mapping functions (a major advantage of KoboToolBox over alternatives, Figure 1.1). KoboToolBox offers a set of easy to use tools, but complex logics can be built with them. KoboToolBox produces sharable forms and is XLSForm compatible (XLSForm is a simple spreadsheet format for designing digital data-collection forms). Data collection can be done offline. Progress of data collection can be monitored without being on-site. KoboToolBox also provides a question library, and has a growing community of practice and online help.
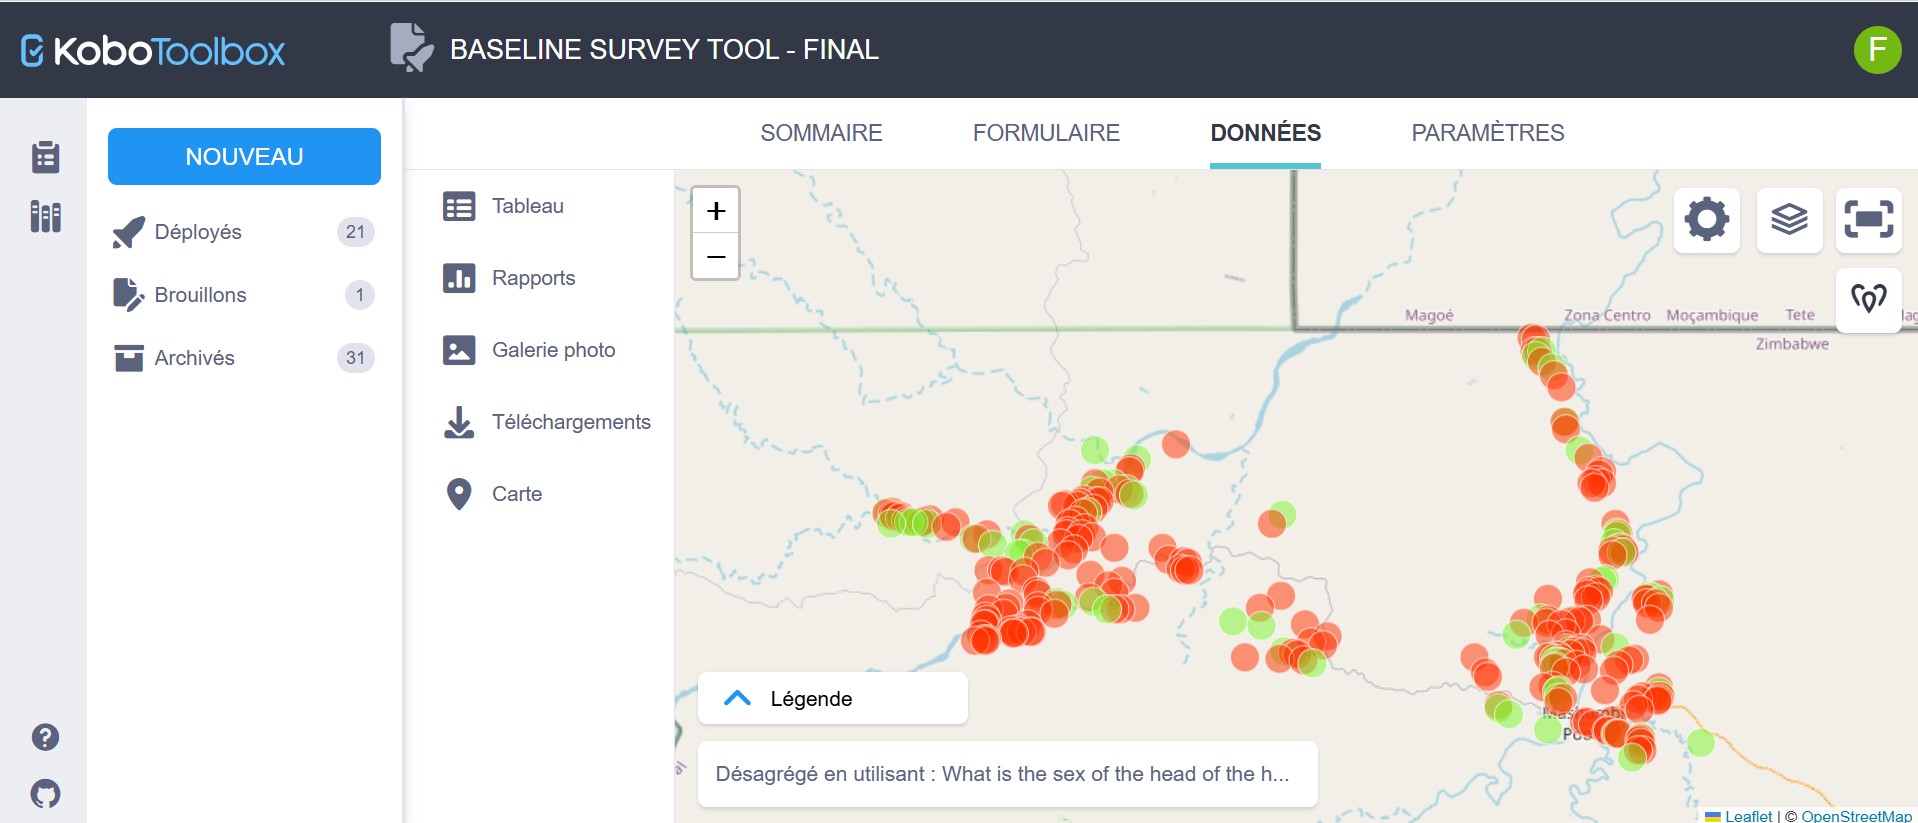
Figure 1.1: Screenshot of the mapping functions of the KoboToolBox server
R is an open-source and free software environment (both a language and a program). As a program language software, it offers replicability and shareability (a major difference with ‘point-and-click’ softwares). R has a large online community, is probably one of the most powerful computer environment for data analysis currently available, and became very popular across many disciplines. Amongst other functions, R reads and writes files, manipulates and summarizes data, runs statistical tests and models, and produces well-designed publication-quality plots. The core functionalities of R are extended by hundreds of packages (and growing). R interacts with other softwares, and the size of datasets analyzed is only limited by the machine used.
1.3 Structure of this book
This book provides a collection of XLSForms (input to KoboToolBox) and well-documented R scripts developed during the implementation of the CGIAR initiative ‘Transformational Agroecology across Food, Land, and Water Systems’, referred to as ‘CGIAR Agroecology Initiative’ in the rest of the document) in Zimbabwe, and that can be adapted to other contexts and projects (Figure 1.2).

Figure 1.2: Workflow used in the CGIAR Agroecology initiative in Zimbabwe to support the codesign process with data, using two open-source softwares: KoboToolBox and R
As such, the book is structured around five main chapters:
Baselining: collecting data from farm surveys and subjecting them to summary statistics (Chapter 3)
Understanding farm diversity and selecting representative farms: farm typologies and stratified samples (Chapter 4)
Managing on-farm experiments: collecting and handling data efficiently (Chapter 5)
Evaluating on-farm experiments in a participatory way: use of Shiny apps (Chapter 6)
Scaling: technology extrapolation domains (Chapter 7)
1.4 Mbire District as a case study
This book uses data from Mbire District as a case study. Mbire District is located in Northern Zimbabwe (Figure 1.3) and is part of the Mid-Zambezi Valley, which is formed by the former floodplains of the Zambezi River between the Victoria Falls and Cabora Bassa Lake, at an average elevation of 400 m above sea level. The Mid-Zambezi Valley has a dry tropical climate, with low and very variable annual rainfall (on average between 450 and 650 mm per year) and a mean annual temperature of about 25°C. Two seasons are clearly defined: a rainy season from December to March and a long dry season from April to November.
Although the study area is communal land (i.e., state-owned land designated for small-scale family farming), it hosts significant wildlife populations (Gaidet, Fritz, and Nyahuma 2003), and is characterized by high biodiversity: over 40 large mammal, 200 bird and 700 plant species have been recorded (Coid et al. 2001). It is an area of great importance for the conservation of many emblematic African mammals including the African savanna elephant (Loxodonta Africana), the Cape buffalo (Syncerus caffer caffer), the African lion (Panthera leo), and the African wild dog (Lycaon pictus).
Mbire was one of the first districts in Zimbabwe to implement the world-renowned Communal Area Management Programme for Indigenous Resources (CAMPFIRE) in 1989 (Taylor 2009). CAMPFIRE enables local communities, through their local government, to manage wildlife as an economic asset for rural development, and is considered one of the earliest programmes worldwide expressing the ‘new conservation approach’ (Hulme and Murphree 1999).
The rich biodiversity of Mbire is threatened by rapid land cover change that was earlier driven by cotton production (Baudron et al. 2011), and more recently by livestock production (Baudron et al. 2022). Wildlife imposes significant costs on local people in the form of crop destruction, livestock predation and human death and injuries, calling for urgent solutions (including landscape designs) that reduce these costs while maximizing benefits from nature.
Several projects implemented by CIRAD and/or CIMMYT have aimed at increasing agricultural productivity in the District with minimum negative consequences for biodiversity, including the project Conservation de la Biodiversité dans la Vallée du Zambèze après Eradication de la Mouche Tse Tse from 1997 to 2003, the project Public-Private-Community Partnerships to improve food security and livelihoods in the South East Lowveld and Mid Zambezi Valley from 2009 to 2011, the research program Competing Claims on Natural Resources from 2006 to 2011, the CGIAR Agroecology Initiative from 2022 to 2024, and the CGIAR ‘Multifunctional Landscapes’ program from 2025 to date.
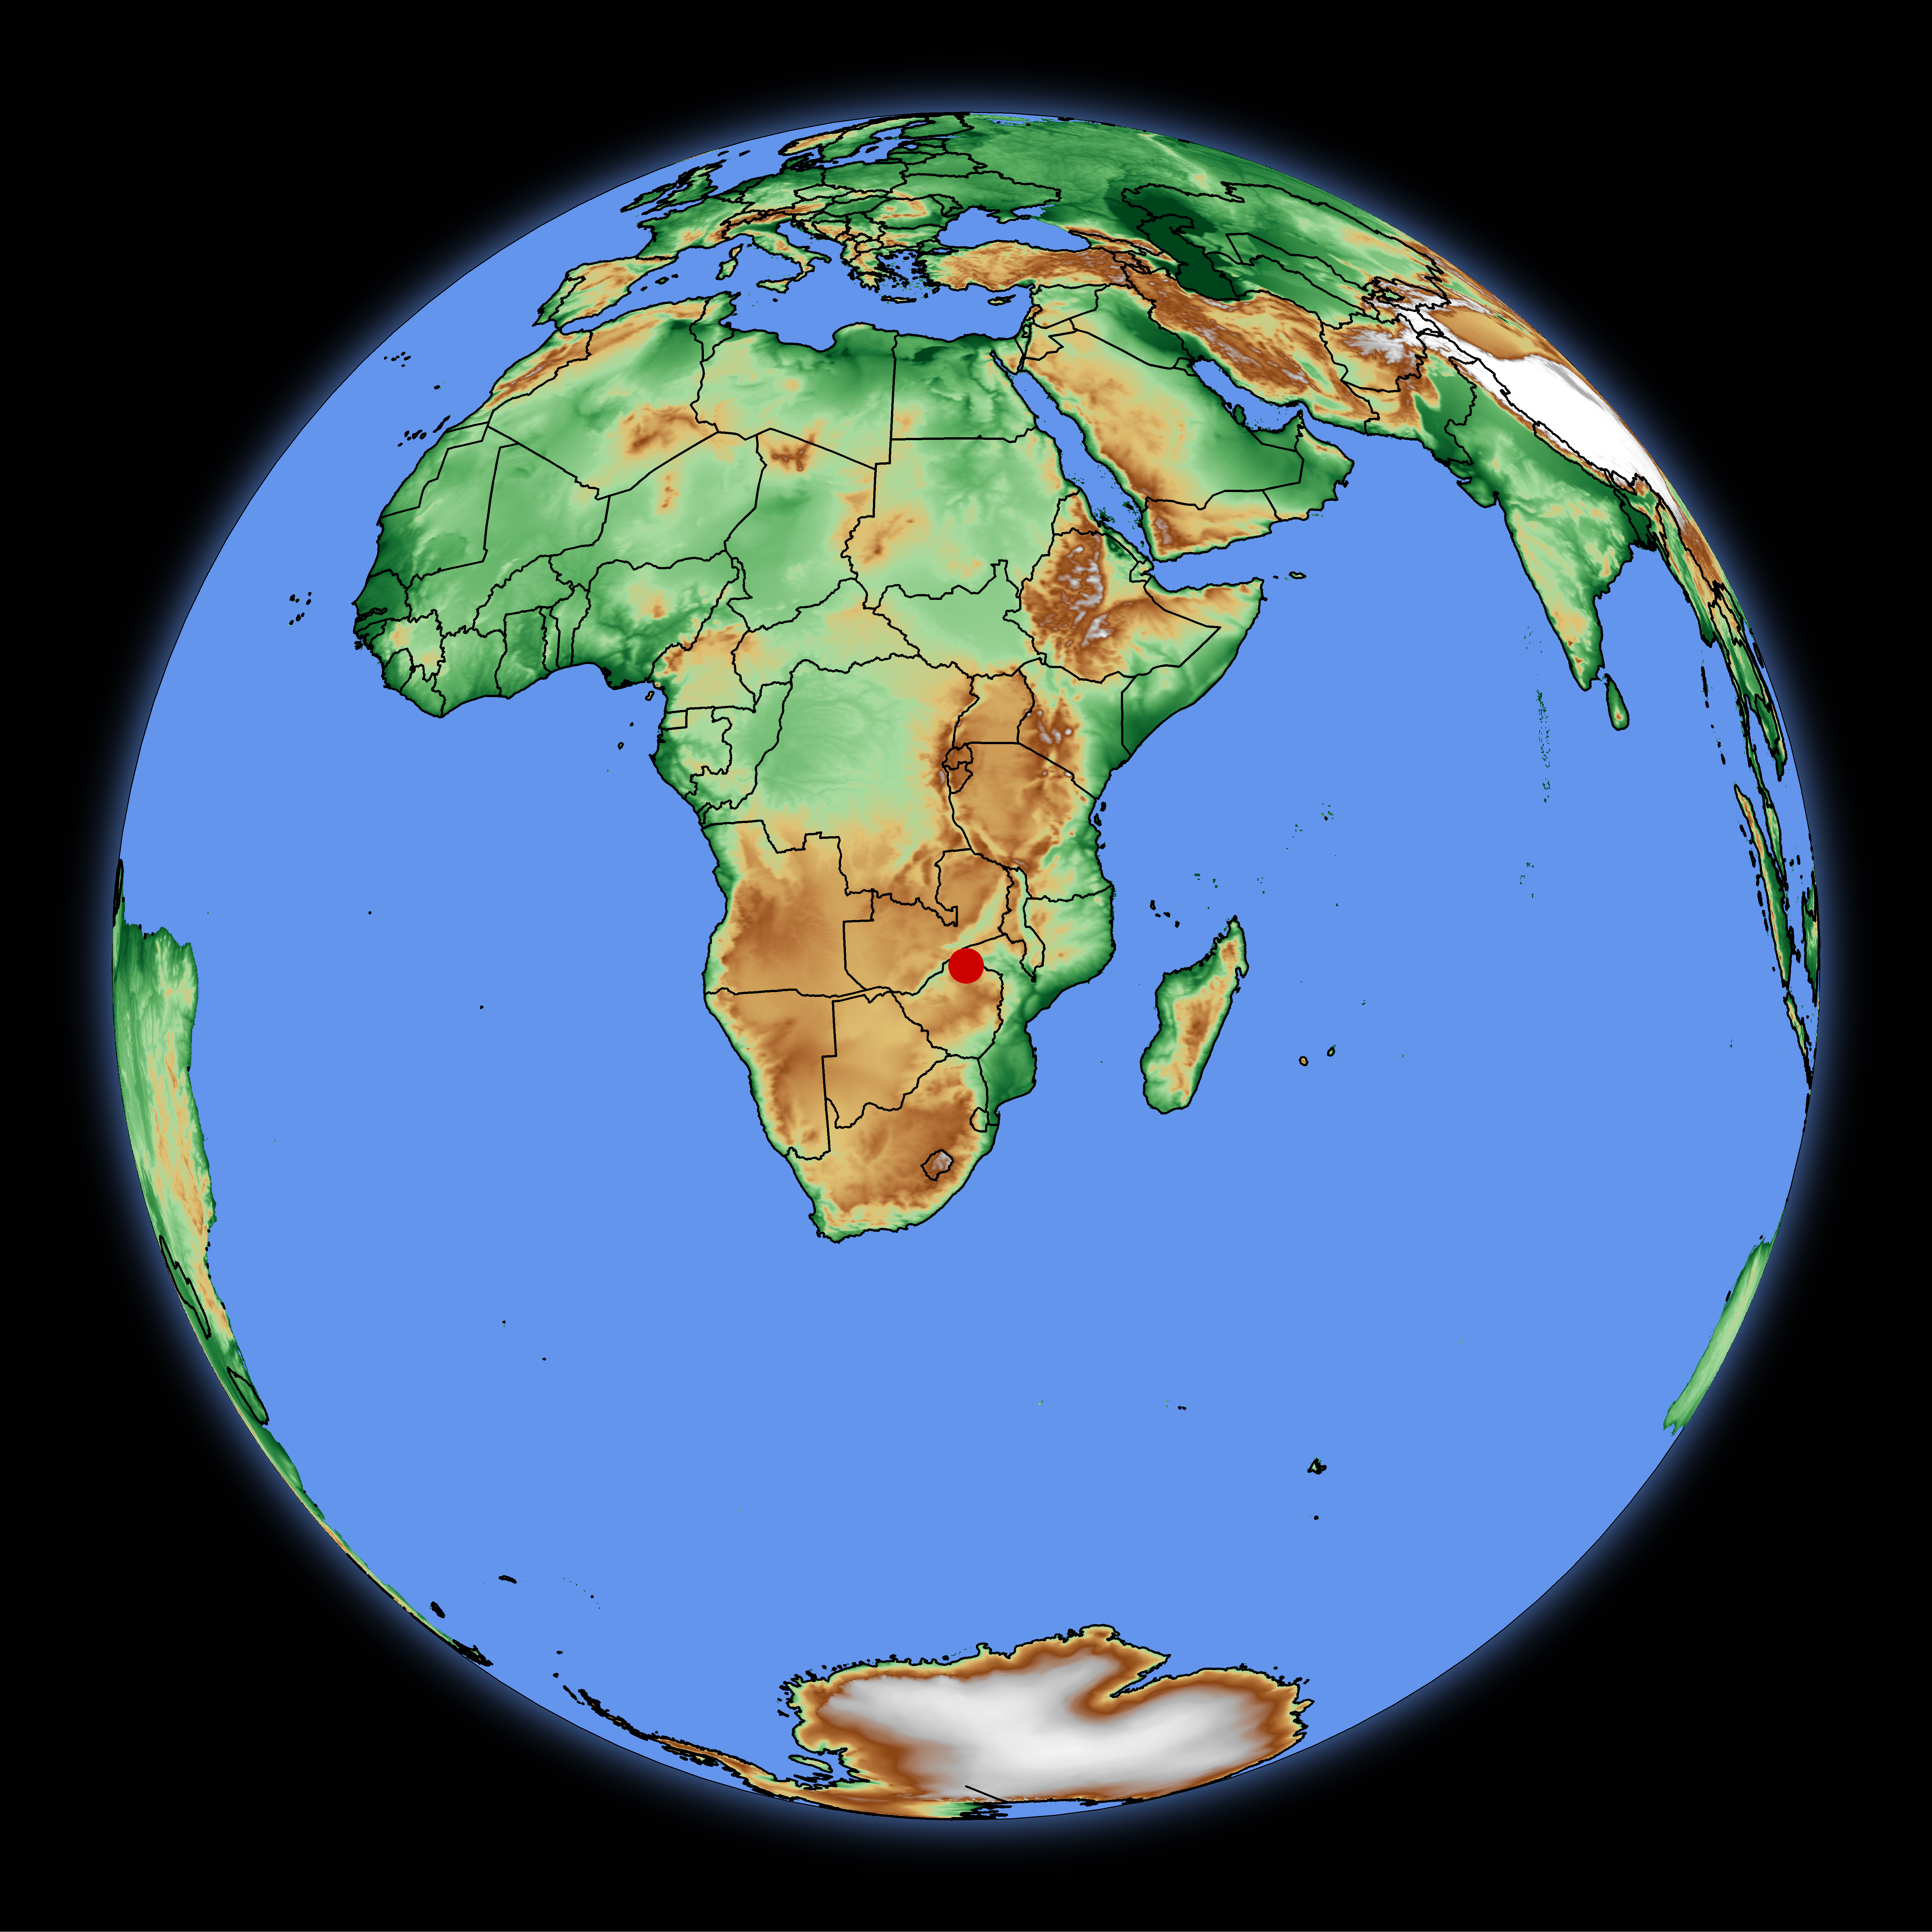
Figure 1.3: Location of Mbire District on an orthographic projection of elevation and country boundaries
Codes to produce the map of Figure 1.3 on R can be found here: https://github.com/FBaudron/Supporting-codesign/blob/main/01-introduction/map_site.R.